


#1 Microsoft Excel Quick Start
- Create and Learn

- Jan 12, 2021
- 3 min read
Updated: Dec 17, 2024

Excel makes it easy to work with numbers. With Excel, you can speed up data entry with AutoFill. Then, get chart suggestions based on your data, and build professional visuals with one click. Or quickly spot trends and patterns with icons, data bars, or color code.
Learn how to:
Create a workbook | Enter data | Save your workbook | Make calculations | AutoSum | Create a chart | Quick analysis | Conditional formatting | Freeze | Share
How do I create a workbook in Excel?
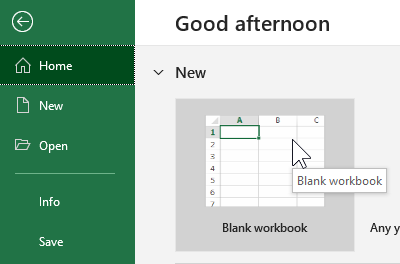
1. Open Excel.
2. Click on Blank workbook. Or, press Ctrl+N.
How do I enter data in Excel?
To manually enter data:
Select an empty cell, such as B2, and then type a text or a number.
Press Enter or Tab to move to the next cell.

To fill data in a series:
1. Enter the beginning of the series in two cells: such as Monday and Tuesday; or 2000 and 2001.

2. Select the cells containing the data series, and then drag the fill handle across or down the cells.

How do I save my workbook?
Save a workbook to OneDrive to access it from different devices and share and collaborate with others.
1. Select File > Save As

2. Enter a file name, select the file type and click on Save.

How do I make simple calculations?
To enter a formula and start making calculations, execute the following steps.
1. Select a cell (D2).
2. To let Excel know that you want to enter a formula, type an equal sign (=).
3. For example, type the formula =B2+C2.
4. Press Enter.
Note: To edit a formula, double-click the cell (D2) and change the formula.

5. The formula below subtracts numbers in the cell D3. Use the minus sign (-).

6. The formula below multiplies numbers in the cell D4. Use the asterisk symbol (*) as the multiplication operator.

7. The formula below divides numbers in the cell D5. Use the forward slash (/) as the division operator.
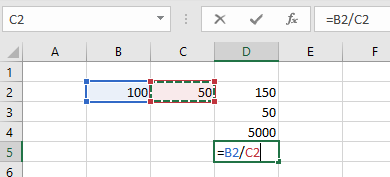
8. See the result:

How do I make calculate with AutoSum?
1. Select the cell next to the numbers you want to add.

2. Select Home > AutoSum .

3. Press Enter.

4. See the result:

How do I create a chart?
A simple chart in Excel can say more than a sheet full of numbers.
1. Select the range A1:B8.

2. On the Insert tab, in the Charts group, click the Column icon.

3. Select the Clustered Column.

4. Excel will create a column chart based on the selected range.

Learn by doing. Step by step guides. Start today!

How do I use the Quick Analysis tool to pick the right chart?
1. Select the data you want to show in a chart.
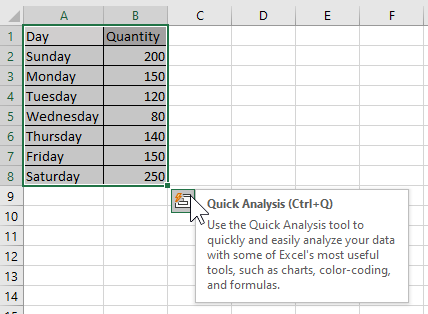
2. Select the Quick Analysis button to the bottom-right of the selected cells.
3. Select Charts, hover over the options, and pick the chart you want.

How do I use conditional formatting?
Use Quick Analysis to highlight important data or show data trends.
1. Select the data to conditionally format.
2. Select the Quick Analysis button to the bottom-right of the selected cells.

3. Select Formatting, hover over the options, and pick the one you want.

How do I freeze the top row of headings?
Freeze the top row of column headings so that only the data scrolls.
1. Press Enter or Esc to make sure you're done editing a cell.
2. Select View > Freeze Panes > Freeze Top Row.


How do I share my workbook?
1. Select Share on the ribbon. Or, select File > Share.

Note: If your file is not already saved to OneDrive, you'll be prompted to upload your file to OneDrive to share it.
2. Select who you want to share with from the drop-down, or enter a name or email address.

3. Add a message (optional) and select Send.

Start leaning Data Science and Business Intelligence tools:


Comentarios